

API Dashboard Overview
Dropbox Sign’s API Dashboard collects information from API calls sent by your account (including test_mode) and pulls it into dynamic charts and discovery tools. The API Dashboard gives customers deeper insight into their API activity and signature requests—empowering you to do things like:
- Monitor the overall health of your integration.
- Troubleshoot and solve issues directly.
- Analyze signature request activity.
- Build a better integration using insights from the API Dashboard.
API Dashboard Location
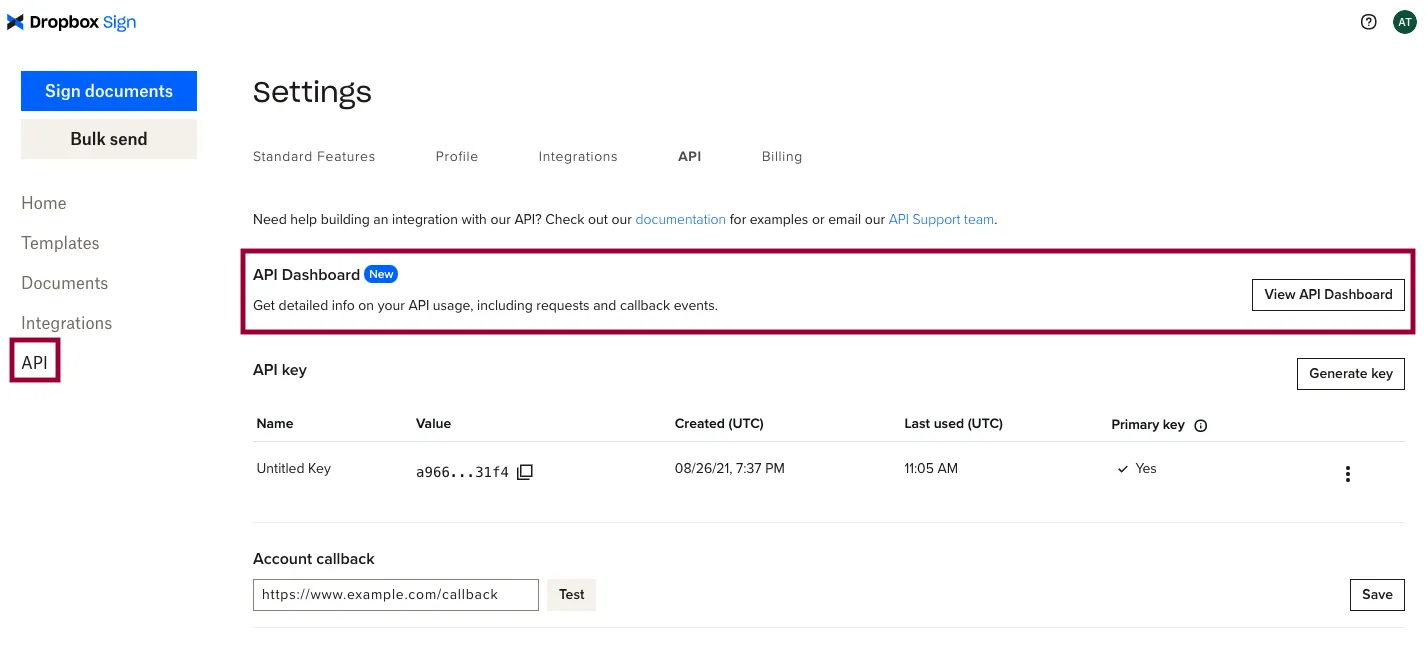
The link to the API Dashboard lives at the top of your API settings page.
Here’s how to navigate there:
| Steps | Screenshot |
|---|---|
|  |
Using the API Dashboard
This section contains information, examples, and tips on using the API Dashboard to discover valuable knowledge about your integration with the Dropbox Sign API.
General Usage Tips
Here’s a short of helpful tips to get you started:
Monitoring Integration Health
The tools in the API Dashboard can help you monitor and maintain the health of your integration. The API requests chart on the Insights will be one of your most powerful tools to discover insights about health. You’ll see it in many of the examples in this guide.
Identify health issues by monitoring trends in errors
Failed API calls can create reliability issues in your application that lead to a bad experience for your users. They’re strong signals about the overall health of your integration.
Read the example below to see how a user navigates this tool and what the charts reveal along the way.
| Notes | Screenshot |
|---|---|
| The API request chart will often serve as source of discovery and primary point of entry for deeper troubleshooting work. | 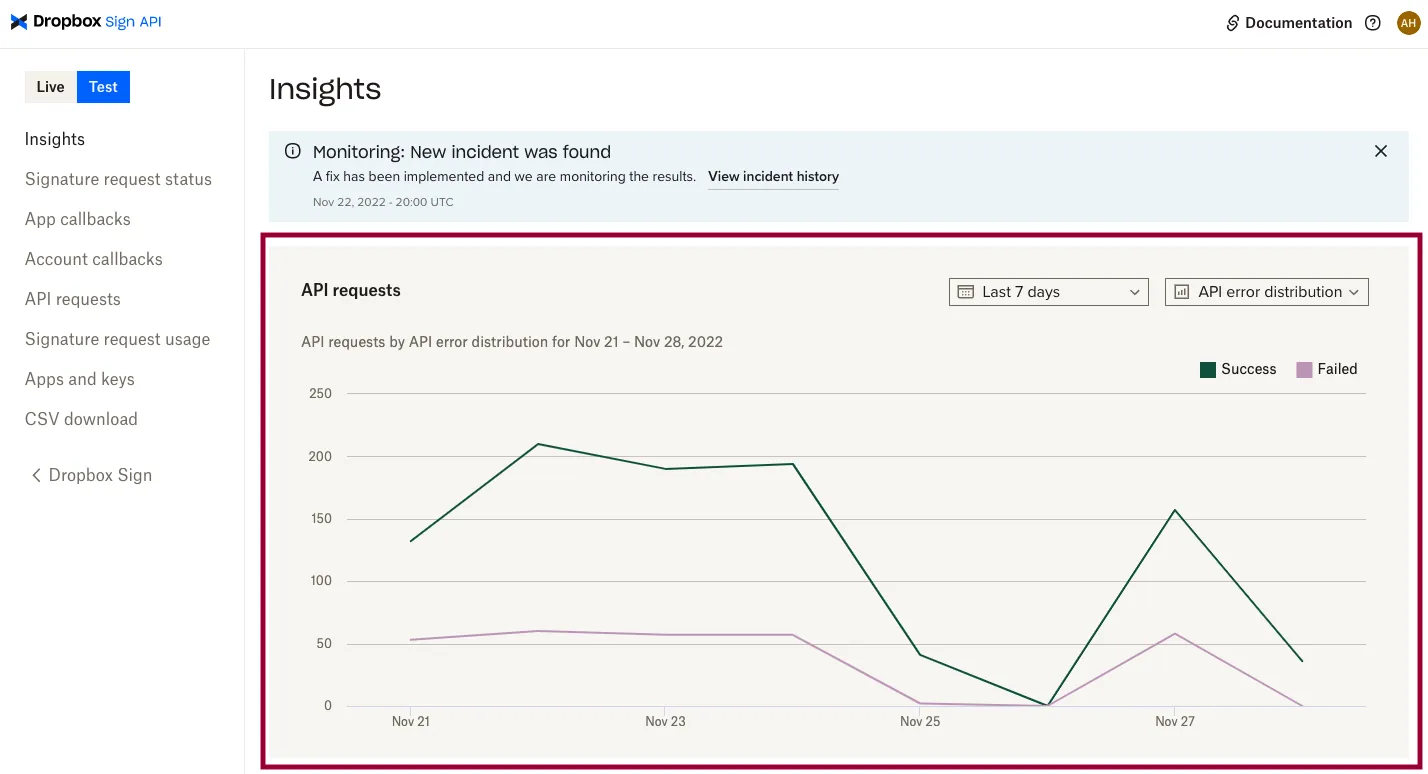 |
| Change the time frame. → Click Last 7 days. → Select Last 30 days from drop-down. Examine the chart. → Notice the spike in failed API requests? Note: you can also choose from 24 hours, 7 days, or a custom date range. | 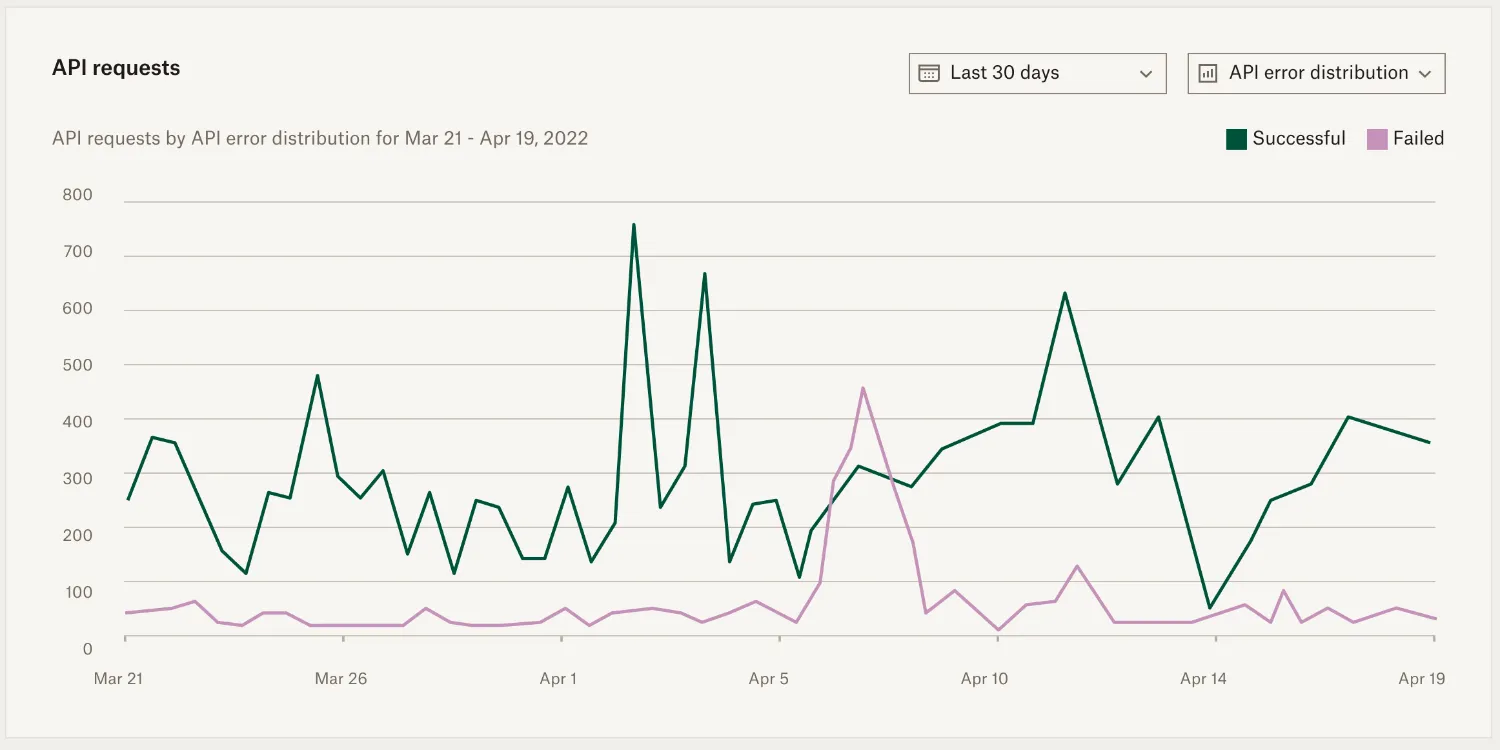 |
| Group data by endpoint. → Click API error distribution. → Select Endpoint from the drop-down. Examine the new chart. → Notice the high failure rate for Get Signature Request? Note: You can also select your own endpoints for custom grouping. | 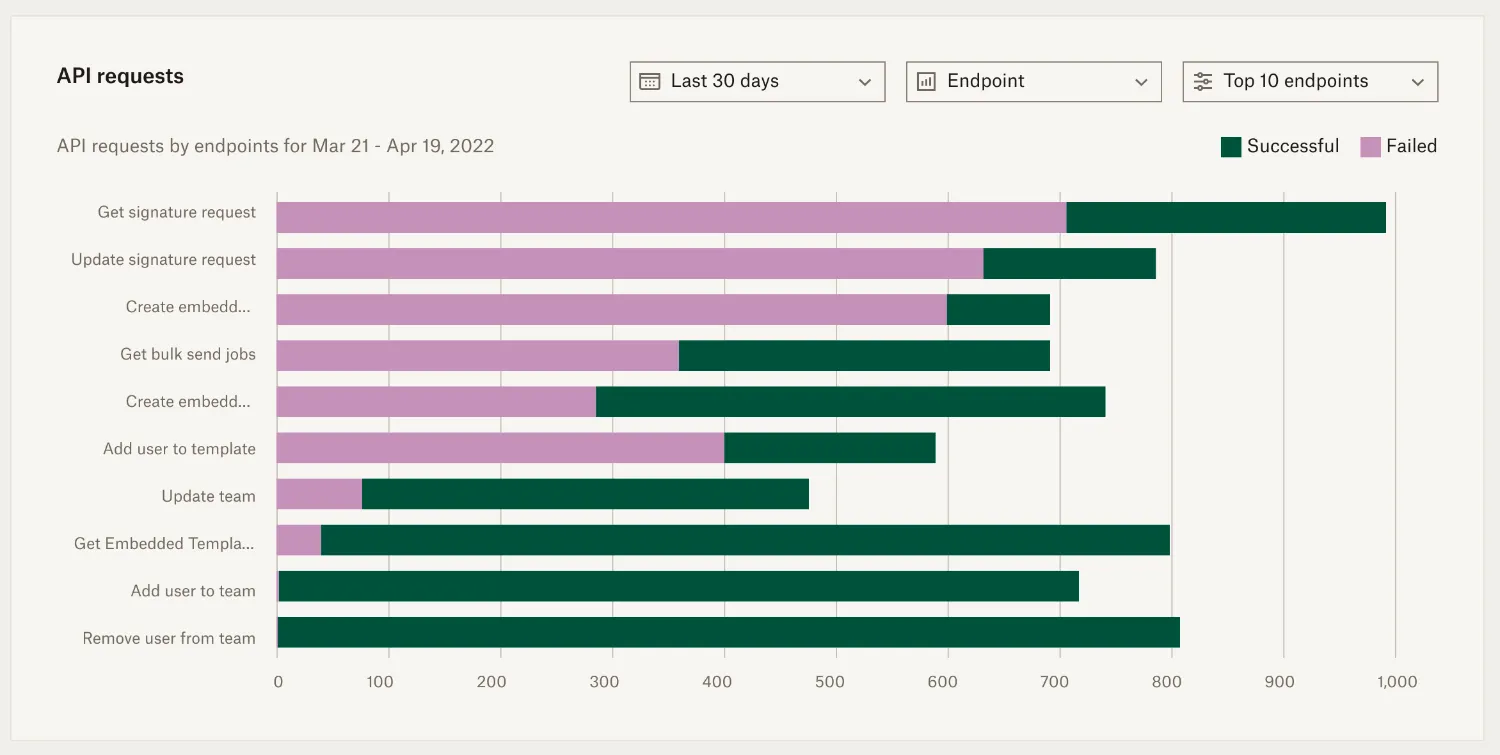 |
| Group data by status code. → Click Endpoint. → Select HTTP Status from drop-down. Examine the new chart. → Notice the high failure rate for Rate limit - 429 and Bad request - 400.Note: you can toggle endpoints on and off by clicking them in the legend. | 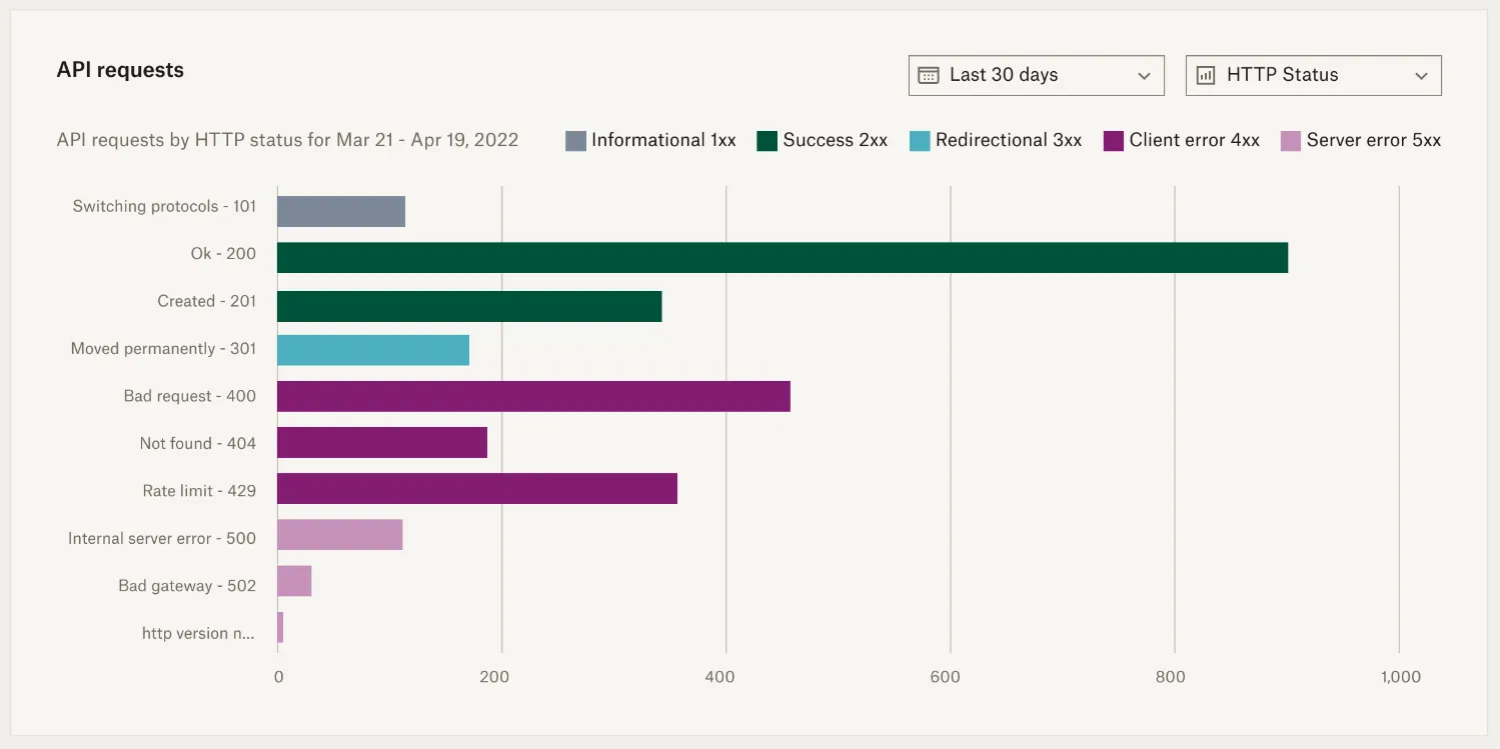 |
In the example above, the API requests chart gave us the following insights into the health of our integration:
- There was a spike in failed API requests around April 7th.
- The Get signature request endpoint had the most failed requests.
- The error is likely a rate limit or malformed request.
Now we’ve identified the problem and have a head start for debugging it.
Discover service disruptions to our API
Any changes to the health of the Dropbox Sign API (such as an outage, degradation of service, or planned maintenance) are immediately added to a banner at the top of the API Dashboard.
The table below demonstrates where to find and track incident information if there was a service issue.
| Notes | Screenshot |
|---|---|
| Discover impacted service from the banner at the top of the page. → Click View incident history for more information. | 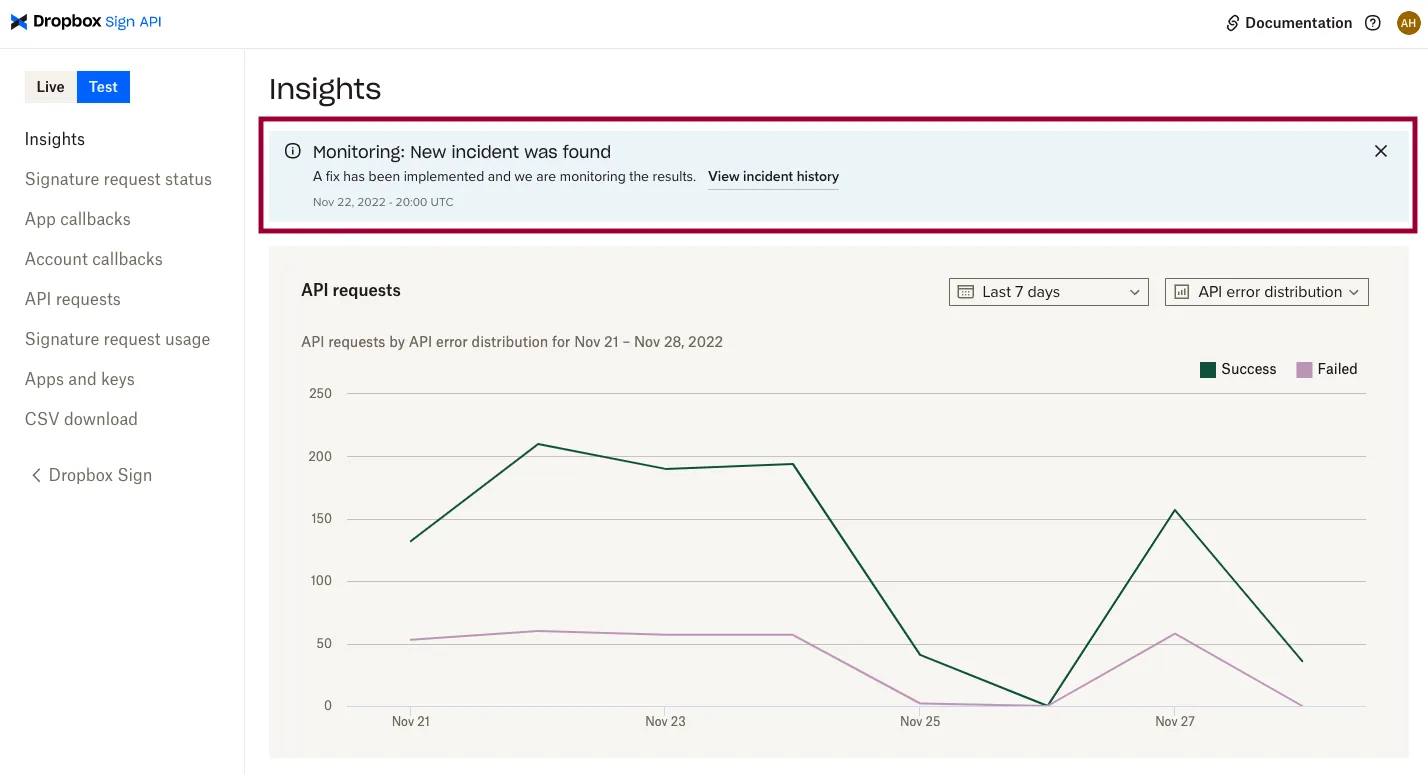 |
| The incident report page contains: → information about the services impacted. → an incident report and chronological updates. | 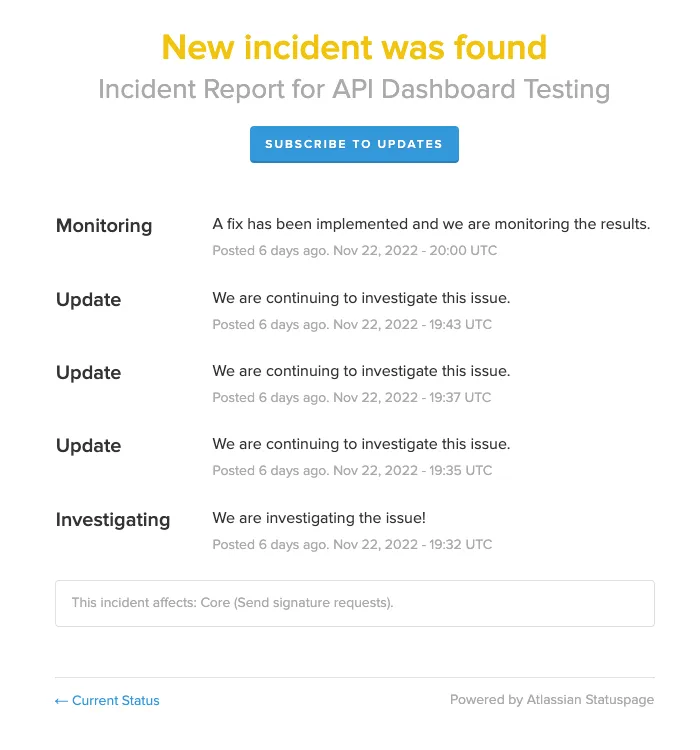 |
Troubleshooting and Debugging
The API Dashboard offers a range of tools for interacting with your data—empowering you to troubleshoot and debug issues with your integration directly. Our API Support team is still available when you need it, but engaging them after you’ve done some of your own debugging means you can you can include identifiers, links, or information that can lead to a resolution more quickly.
Use all your tools There are multiple paths to discovery when you’re troubleshooting. Remember to use the full set of tools available to you.
- API requests chart
- Search
- Filters
- Clicking through connected data
Improve integration health using insights from failed API calls
Did you know you can click through chart results on the Insights page? That approach is one of the best ways to start troubleshooting health issues you see in charts (especially for failed api calls). The links direct you to the list of data populating the graph with filters already applied.
Let’s step through an example of how you might approach troubleshooting a health issues.
| Notes | Screenshot |
|---|---|
| While using the API Dashboard you notice a spike in failed API calls and decide to investigate. → On the API requests graph, hover over a specific day to reveal a pop up with more information. → Click Failed to be redirected to the API requests page. | 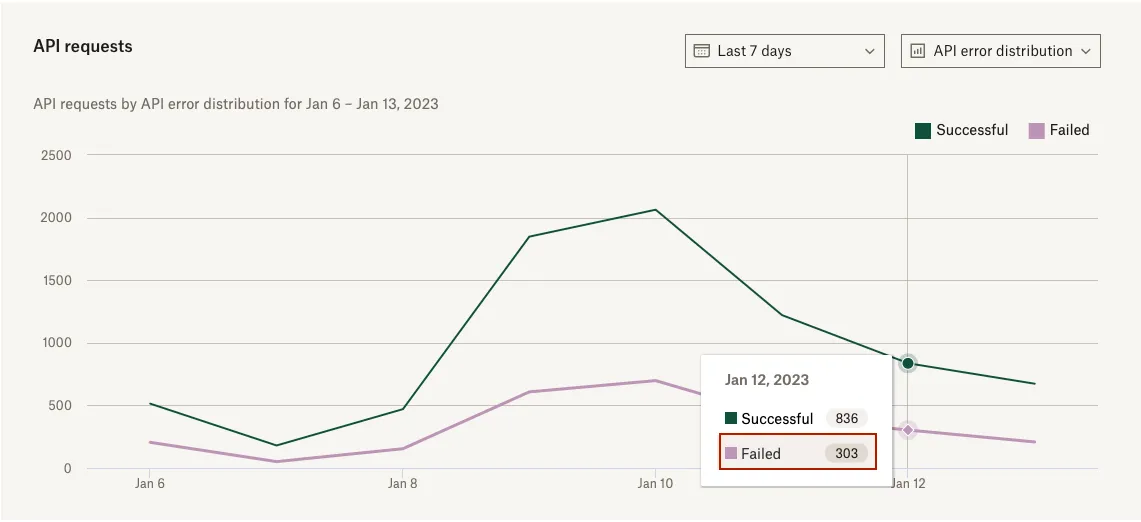 |
| The API requests page will list all failed API calls pre-filtered by: → Date (from previous step). → HTTP Status. | 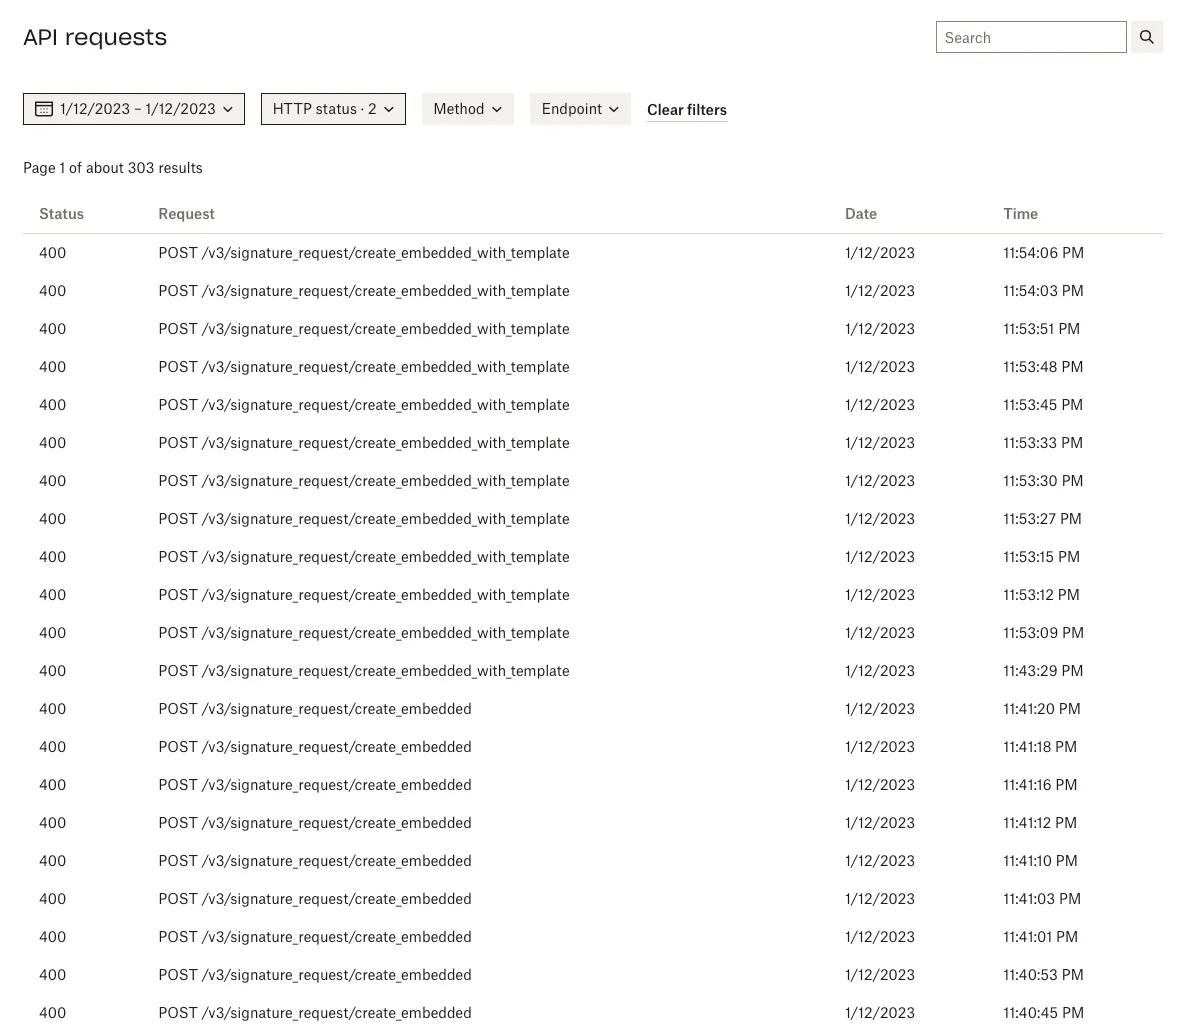 |
| Click on a single entry to learn more about that specific call. | 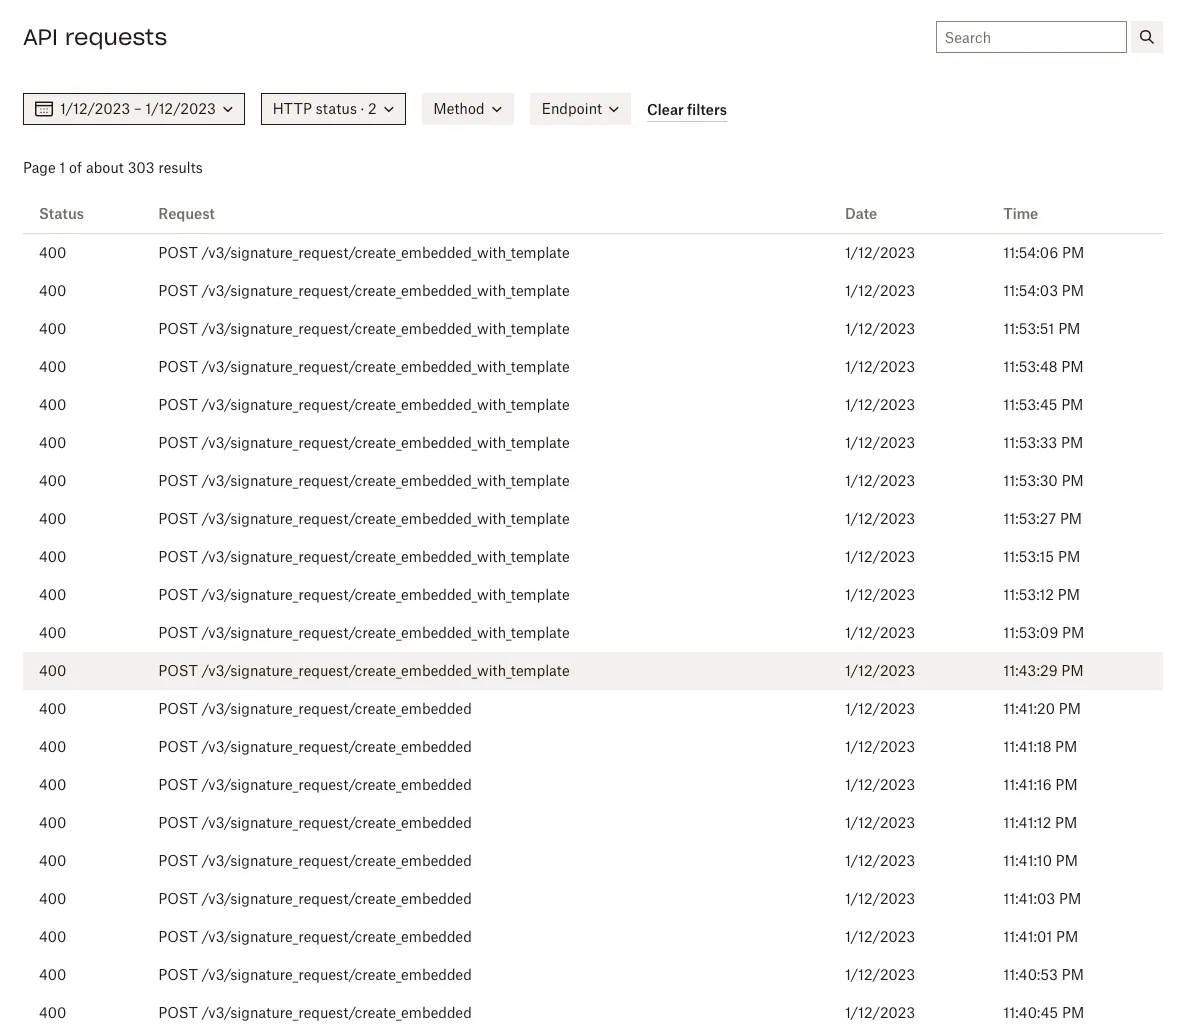 |
| Review details associated with that call. → Take note of the error in the Response body. → Cross-reference with the POST Parameters sent in the request. | 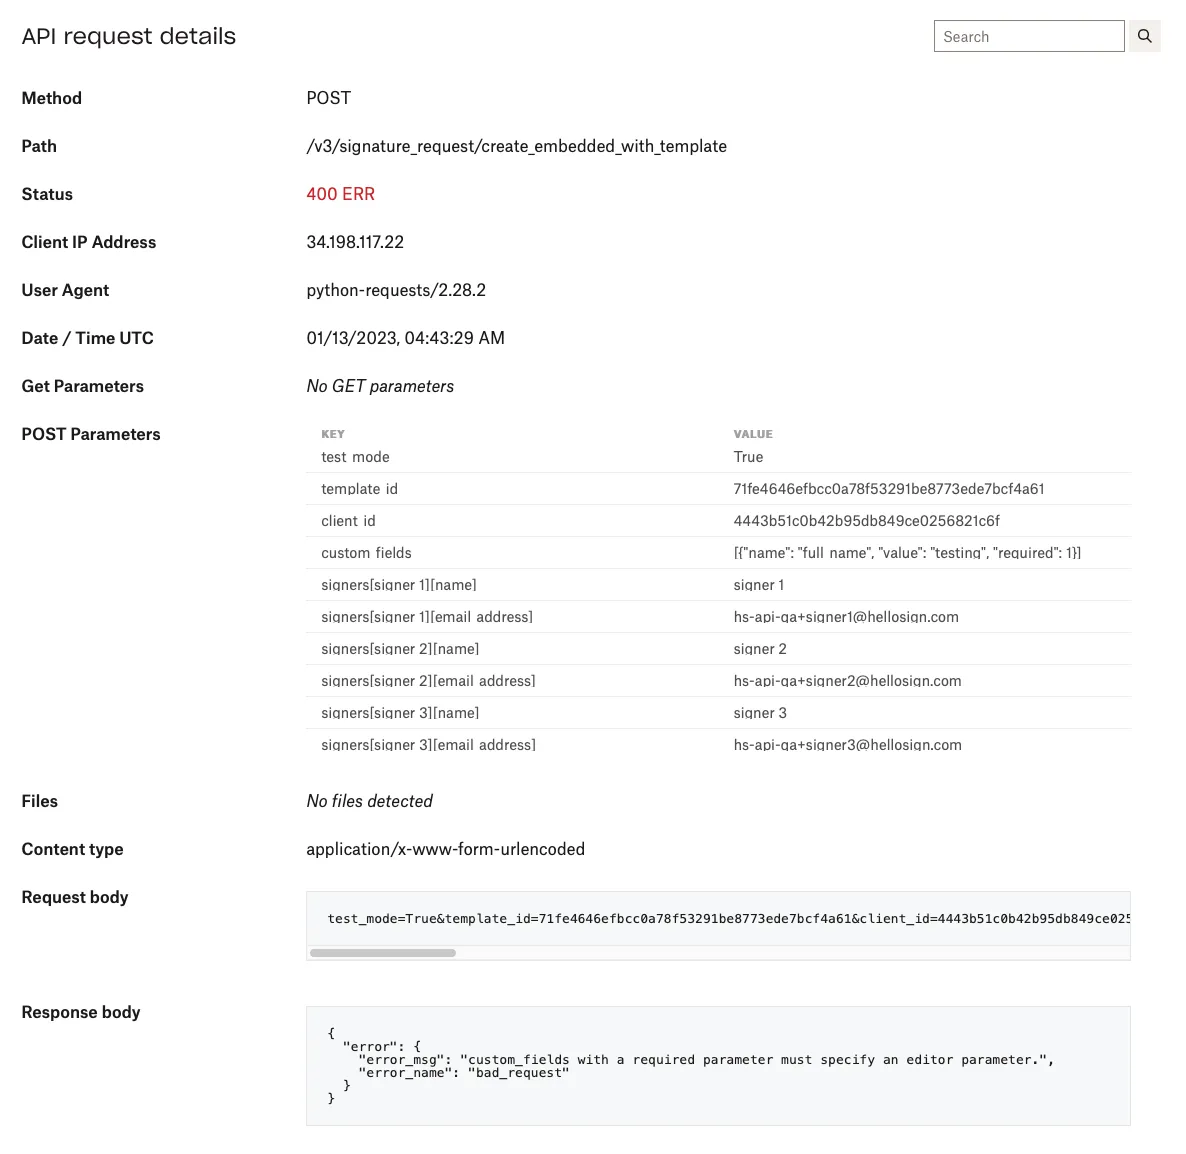 |
Understanding Signature Request Activity
Having a clear understanding of your signature request activity is an essential part of maintaining a healthy integration. The API Dashboard can give you visibility into things like:
- Quota consumption
- Signature request health
- Historical trends in signature request usage
Exploring data around signature request usage (and signature requests themselves) is a great way to discover optimizations that lead to more completed signature requests. Think about it like troubleshooting a health issues in the signing experience you offer your users.
Track account subscription and quota consumption
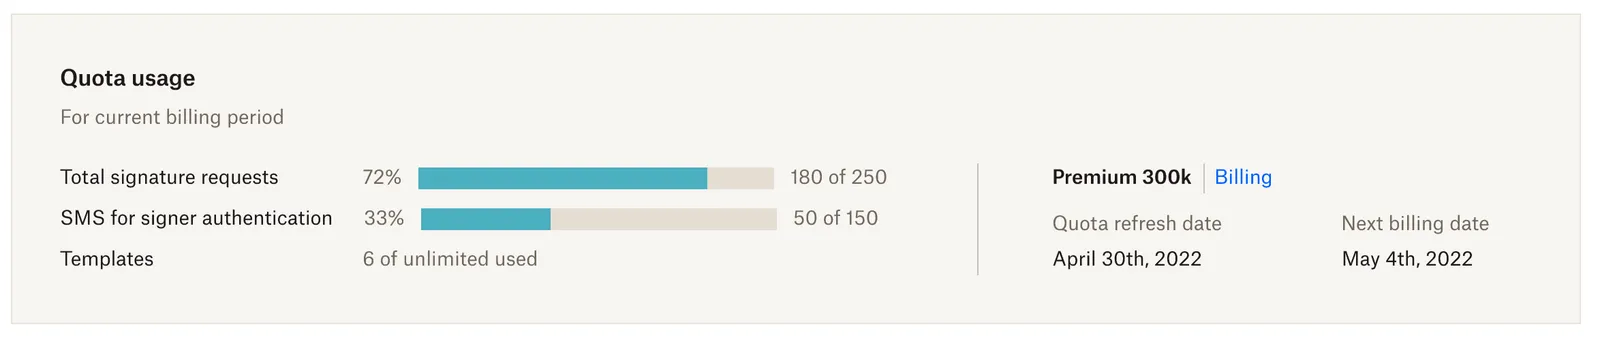
The quota usage section of the API Dashboard gives you direct insight into your most important usage information for your current billing period. Here’s what you’ll find there:
- Number of signature requests and templates remaining.
- Usage data for any add ons you have (SMS delivery, eID, Qualified Electronic Signature, etc).
- Subscription information like quota refresh date, next billing date, and subscription tier.
Learn from trends in signature request usage
Exploring patterns around signature request usage can reveal valuable insights about your customers, your integration, and help you make proactive decisions around your subscription. Here are examples of the type of insights you might discover:
-
Seasonal or recurring bursts of signer activity.
- Upgrade your API plan to meet demand before your busy season.
- Proactively make a plan for hitting rate limits.
-
Historical signature request usage
- Identify a shift in your marketing strategy.
- Explore how a market condition impacted your signature request usage during a specific time frame
-
Identify Customers with a high rate of growth
- If you have a model where your customers each have their own api app, then looking at signature request usage by
client_idmight give you signal on who needs your attention.
- If you have a model where your customers each have their own api app, then looking at signature request usage by
-
Recurring patterns
- “Our signature requests peak every quarter. Let’s hire a temp every 3 months.”
Team Admin Global View
So far we’ve discussed how the API Dashboard can be leveraged to better understand your own personal account activity. For Team Admins, we also provide the capability to expand those insights and details to include your entire team. With the Team Admin Global View, Team Admins can effectively collaborate within their teams and maintain a robust API integration; keeping their business running smoothly.
Team accounts
All Team Admins have access to view any of their team account’s signature request details by selecting the account via a dropdown located below the Live and Test toggle switch in the top left corner of the API Dashboard.
| Notes | Screenshot |
|---|---|
| Admin Global View dropdown selection located in the top left of the dashboard. | 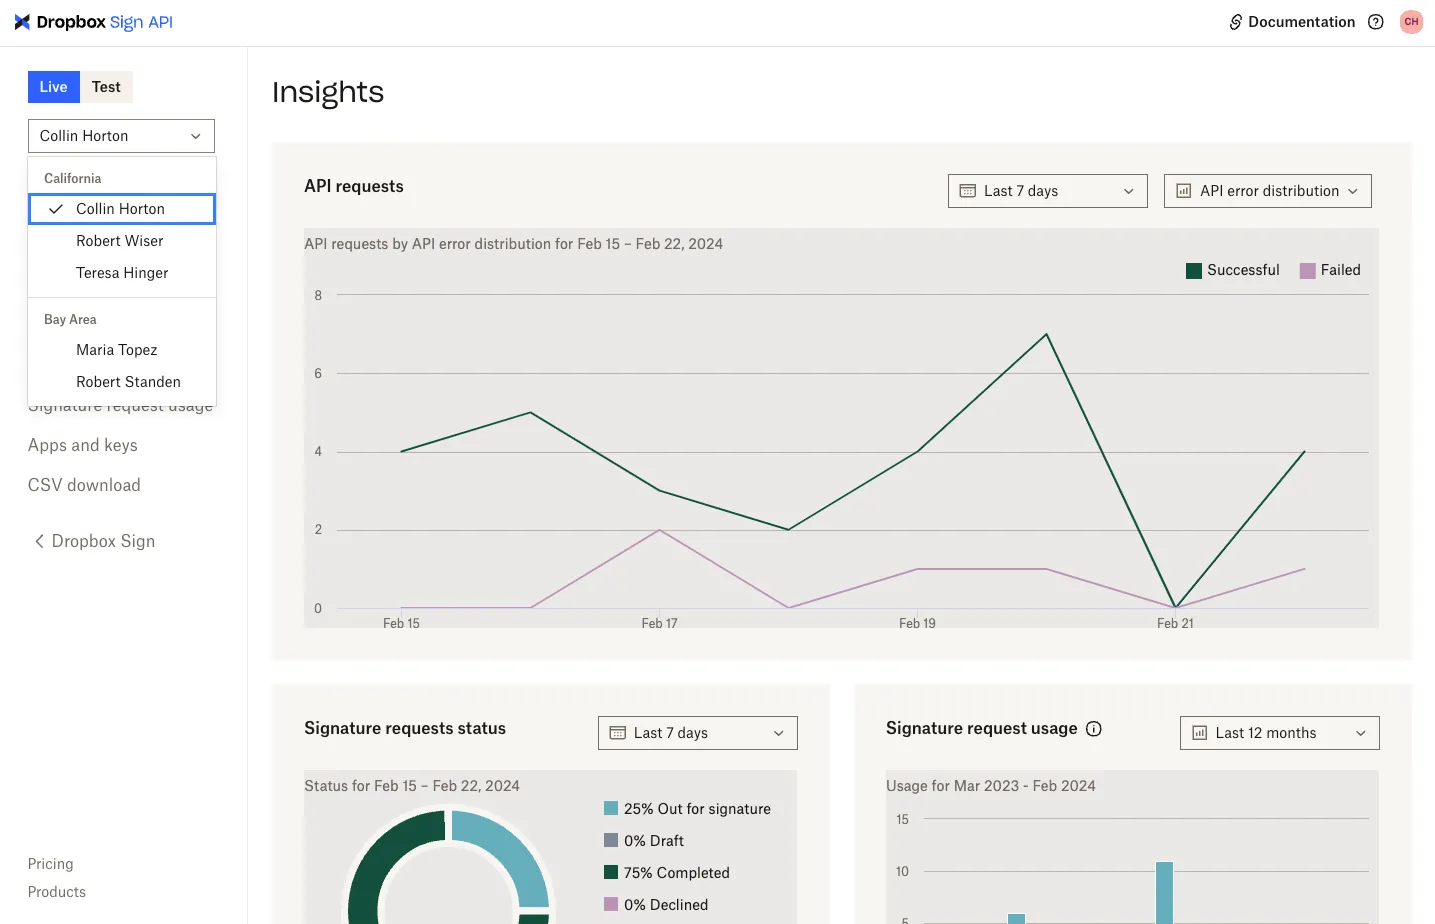 |
Once an account is selected, the information included on all pages within the dashboard will populate the signature request details for that specific account. For example, let’s say you have 3 accounts: account A, account B, and account C. If you select account B in the dropdown, the pages within the dashboard will reflect signature request details for account B. If you change the dropdown to account C, each page will be updated to display account C’s signature request details. Additionally, toggling between Live and Test will update the data to display either the production or test requests for the selected team member.
Note: Selecting on the Apps and keys tab will navigate the Admin to their own API settings, not the team member’s settings.
Here are the pages that will reflect the team member specific information:
- Insights
- Signature Request Status
- App Callback
- Account Callback
- API Requests
- Signature Request Usage
- CSV Download
Multi-Teams
For accounts that have enabled the Multi-Team feature, the Global Admin View also enforces the [Multi-Teams access & controls] (https://help.dropbox.com/account-access/multi-teams-roles-dropbox-sign) determined by the team member’s organizational role. This enables Admins to effectively collaborate with their teams, while ensuring Sub-Team Admins only have access to their respective Sub-Team’s account activity. All team members will be organized by their sub-level team in the dropdown selector. Global Admin View will support a maximum of 3 team levels and up to 50 teams to view.
Searching
We provide a universal search on the API Dashboard that can search against Signature Requests, App Callbacks, Account Callbacks, and API Requests. Queries on fields can be combined using AND and OR operators (operators are case sensitive), and you can add a NOT operator to exclude results. A warning, some fields are not supported for all search tabs, and when using exclusively NOT operator on fields, you’ll get results back in the tabs that don’t support the field. Dates may be passed in as ranges. Exclusive ranges are indicated with curly brackets {min TO max} and inclusive ranges with square brackets [min TO max]. An example search timestamp:[2024-01-01 TO 2024-12-31] AND NOT method:POST AND status_code:(200 OR 400) the square brackets search dates from the 1st of January thru the 31st of December (inclusive dates). The table below lists all possible fields that can be queried:
Appendix
Limitations on data in the API Dashboard
Note: The same limitations apply when searching team member data using the Admin Global View.
Frequently Asked Questions
Why is my dashboard empty?
Your account hasn’t generated enough data yet. You need to reach a minimum threshold before the API Dashboard can populate with data. Go send some test_mode calls!
What API plans can use the dashboard?
The API dashboard is available for all API accounts, both paid and free.
What information can I use in the search?
How often does the service alert banner get updated? Is it automatic?
The banner at the top of the page will update every 5 minutes. After the incident is resolved, the banner is displayed for a minimum of 24 hours.
Do I need to be on a specific API plan to have access to the Admin Global View?
No, every plan will have access to Admin Global View once the user creates a team and adds members to their team.
Can more than 50 teams be viewed with the Admin Global View?
No, our multiple teams feature only allows a maximum 3 levels of teams with a total of 50 teams. Please see these articles for more information on multiple teams:
Will the signature request details for multiple team members be viewable at the same time?
No, you can only select one team member’s account at a time to view signature request details.